The Assessed module is the analytical environment where previously configured scenarios undergo assessment. Through this process, probability, impact, and exposure levels are determined to obtain the actual risk index. As these assessments are completed, the site analysis takes shape until a global result is consolidated.
Access Path
To access the assessment environment, follow the standardized navigation path:
- Make sure you are in the Home view of the Main Dashboard.
- Locate the horizontal ribbon of operational indicators and click directly on the button labeled Assessed.
- The system will open the corresponding interface within the assessment section.

Scenario Assessment Process
The rating of each Asset-Threat cross is performed through a structured wizard in two consecutive steps:
Step 1: Scenario Description This screen is dedicated to the qualitative documentation of risk. It contains text fields that can be filled manually or with AI assistance by clicking the Generate with AI button. The elements to document are:
- Causes: Origin or factors that lead to the materialization of the threat.
- Facilitator: Environmental conditions or vulnerabilities that favor the event.
- Consequences: Direct impact on the organization if the risk materializes.
- Implemented Measures (Optional): Security or prevention controls already in place.
- Measures to Implement: Recommendations or future action plans to reduce vulnerability.
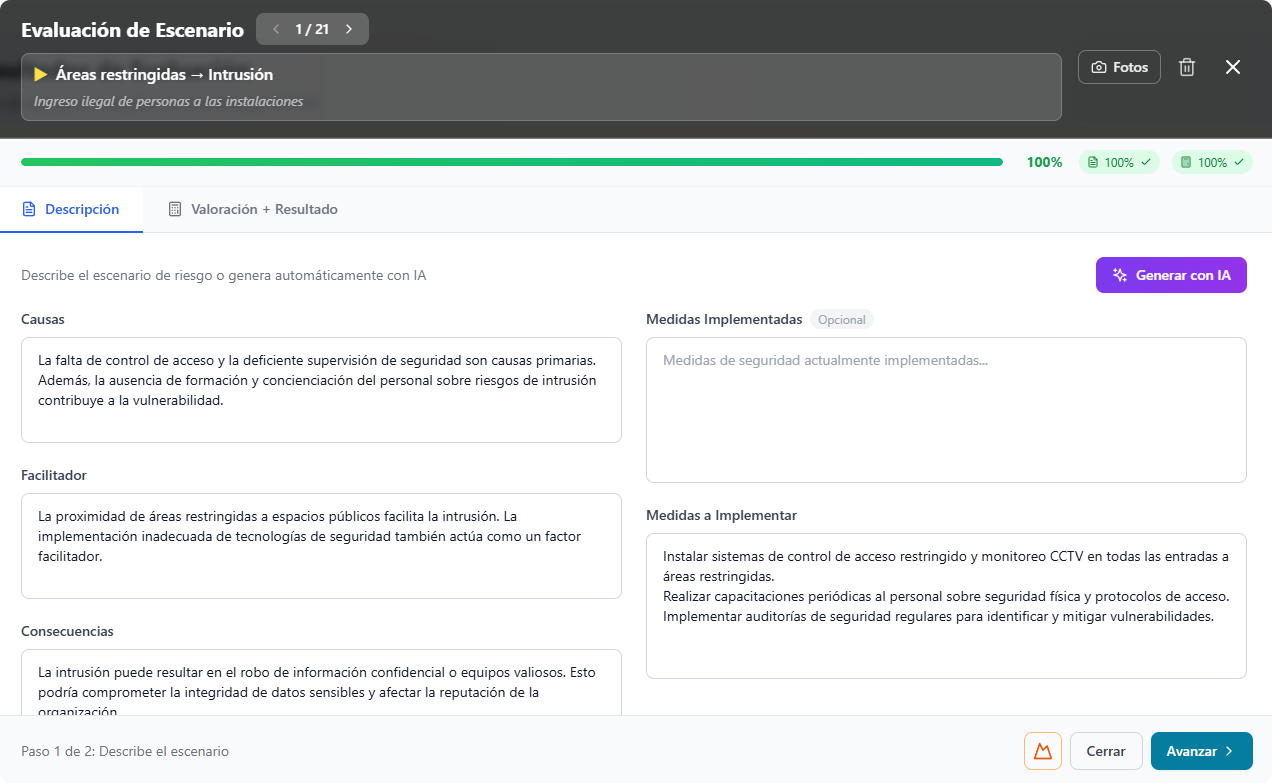
To continue to the assessment phase, click the Next > button.
Step 2: Assessment + Result In this section, the Criticality Index (CI) of the scenario is determined by evaluating its base components:
- Probability: Calculated by multiplying the Exposure (EF) and Occurrence (OF) factors. Under the methodological premise that inherent risk equal to 0 does not exist, when rating Exposure (EF) a minimum value of “Very Low” must be used, and when rating Occurrence (OF) a minimum value of “Very Rare” must be used.
- CARVER Factors: Values are assigned to the six dimensions of the model (Criticality, Accessibility, Recoverability, Vulnerability, Effect, and Recognizability) to obtain the Average Consequence.
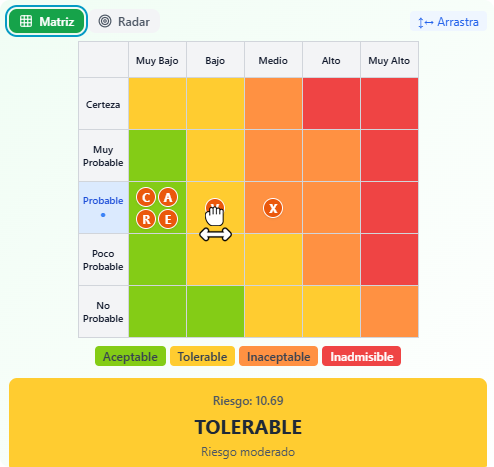
- Matrix and Radar: In the right panel, the system automatically generates visual representations. The Matrix view crosses Probability against Consequence to project the final risk level (e.g., ACCEPTABLE, TOLERABLE, UNACCEPTABLE, or INADMISSIBLE). In this view, factors can be “dragged” manually for a simpler process.
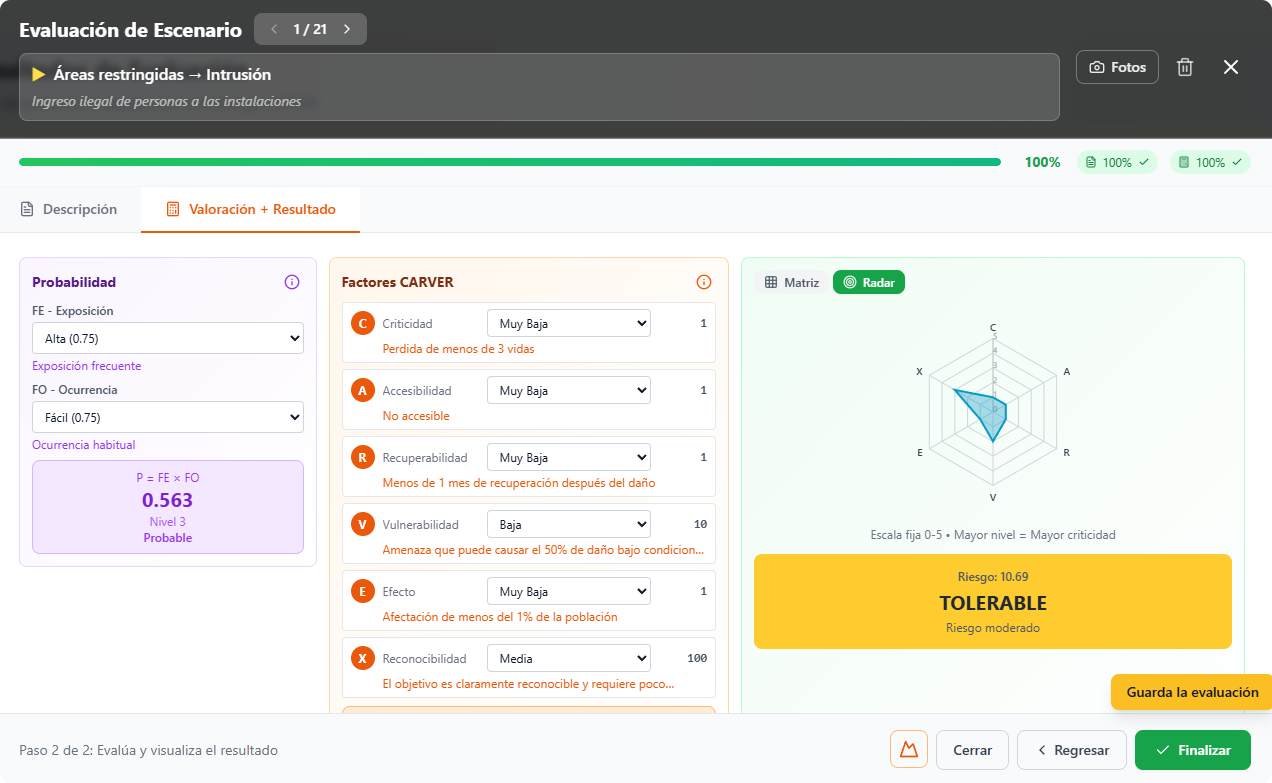
Once the values are verified, click the Finish button (or “Save the assessment”) to record the result in the system.
Assessment Results (Site Dashboard)
Site Global Level: A macro indicator that determines the overall status of the facility based on individual assessments.
Level Distribution: Summary cards that count how many scenarios resulted in Acceptable, Tolerable, Unacceptable, and Inadmissible levels.
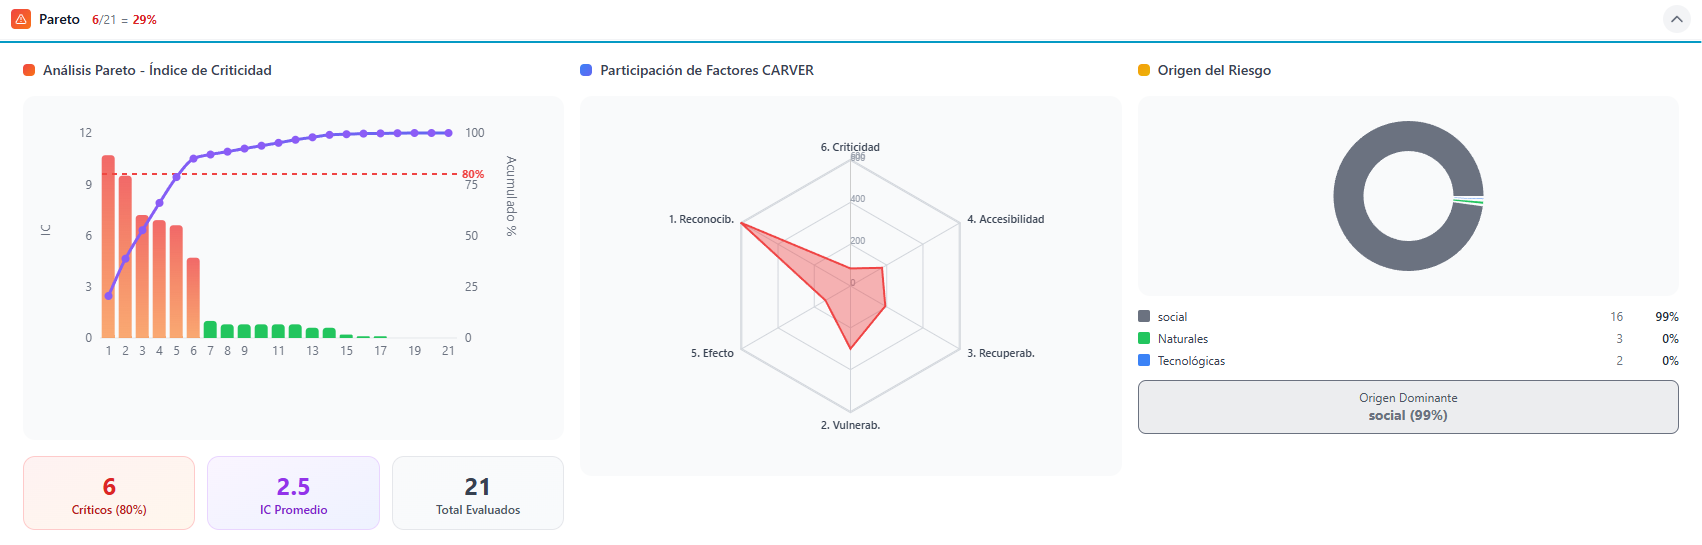
As scenarios are assessed, the system compiles the information into a consolidated panel, accessible from the central bar with the labels “Pareto, CARVER, and Origin”. This panel presents:
-
- Pareto Analysis – Criticality Index: Chart that identifies the vital scenarios that accumulate the highest percentage of risk, dictating attention priorities.
- CARVER Factor Participation: Radar chart that exposes which specific methodology variables present the greatest aggregated vulnerability.
- Risk Origin: Donut chart that breaks down the dominant origin of threats (Social, Operational, Natural).
Scenario Summary Table: A detailed directory that displays the identification key (ID), the scenario name (Asset – Threat), and the breakdown of all applied variables (EF, OF, P, CARVER values, Average Consequence, final PxC calculation, cumulative Pareto percentage, and Risk Level).