Tabla de contenidos
The Analytics panel constitutes the most advanced data intelligence environment of the platform. Its purpose is to consolidate information from multiple assessments and cross-reference it with environmental variables. This enables multi-level comparative analyses, identification of recurring threat patterns, and auditing the vulnerability status of the entire value chain from a single unified view.

Global Summary
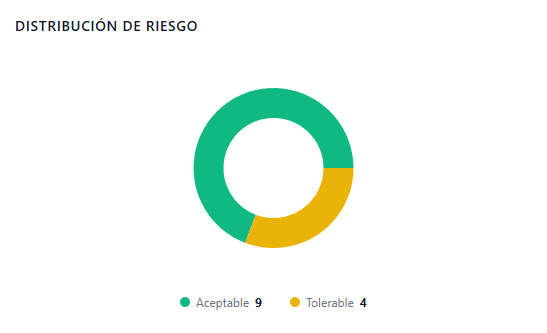
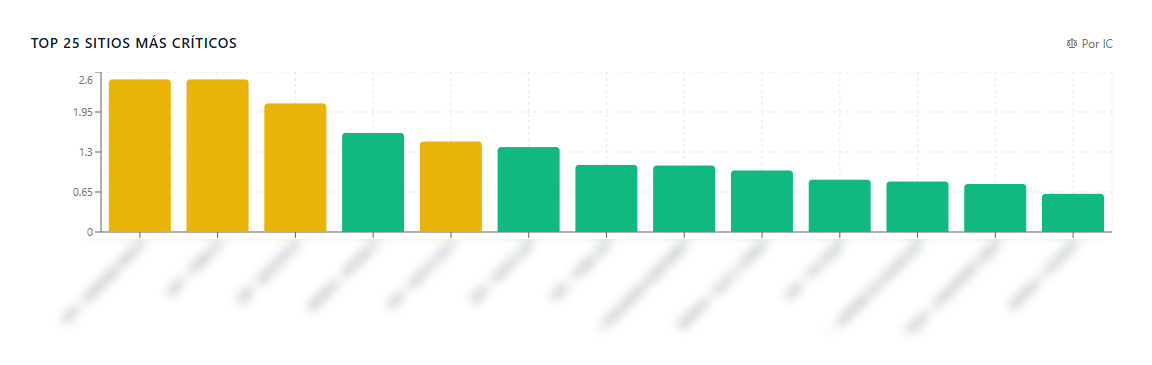
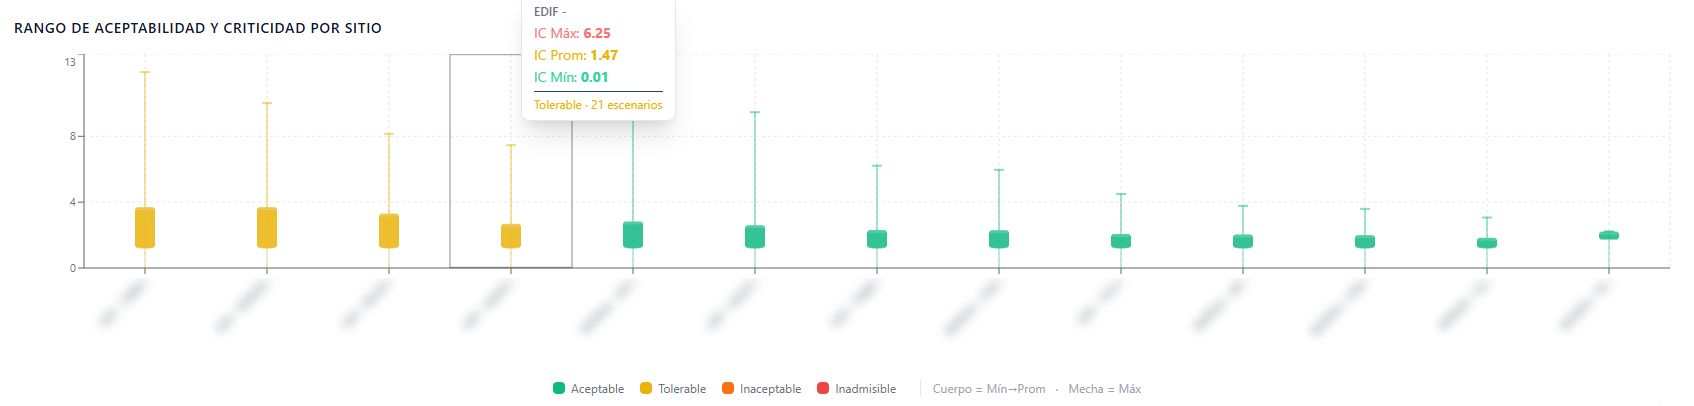
The main Analytics screen offers a consolidated control dashboard to monitor risk distribution across all assets and facilities assessed by the organization:
- Consolidated Risk Distribution: Analytical chart showing the total proportion of facilities classified under the methodology’s normative parameters (Acceptable, Tolerable, Unacceptable, and Inadmissible).
- Top Critical Sites: Bar chart that ranks branches or logistics locations with the highest Criticality Indices (CI), enabling prioritization of budget and physical protection resource allocation.
- Acceptability Ranges and Variability by Site: Statistical dispersion charts (box plots) that transparently show the gap between minimum, average, and maximum risk scenarios for each facility. In strict compliance with the system’s methodology, every assessed scenario records a value greater than 0.01, ensuring that zero risk is not considered in the protection model.