
The Mitigated module is the phase where theoretical management becomes operational action. In this section, security measures and controls (physical, technological, or procedural) designed to reduce asset vulnerability are documented, assigned, and evaluated. The central objective is to transform the initial risk (Inherent) into an acceptable or tolerable risk (Residual).
Access Path
To access mitigation management, follow the standardized navigation path:
- Make sure you are in the Home view of the Main Dashboard.
- Locate the horizontal ribbon of operational indicators and click directly on the card labeled Mitigated.
- The system will open the corresponding interface, displaying in the left sidebar the section for TREATMENT, which includes sections such as Residual Map, Assignment, Results, and Dashboard.

The Residual Map: Analytical Comparison
The main screen of this section stands out for its Residual Map, a high-level comparative visualization tool that demonstrates the effectiveness of the implemented security strategy.
Mitigation Indicators Bar (KPIs) At the top, a panel summarizes the impact of controls on the selected site:
- Total Scenarios: Shows the number of assessed scenarios and how many of them already have assigned controls.
- Average Inherent CI: The original Criticality Index (CI), calculated before implementing any protective measure.
- Average Residual CI: The new estimated Criticality Index after effective application of controls.
- Reduction: A global percentage that quantifies the risk decrease at the facility, serving as the main metric for security investment return.
- Configured Sites: Counter of locations being analyzed under this methodology.

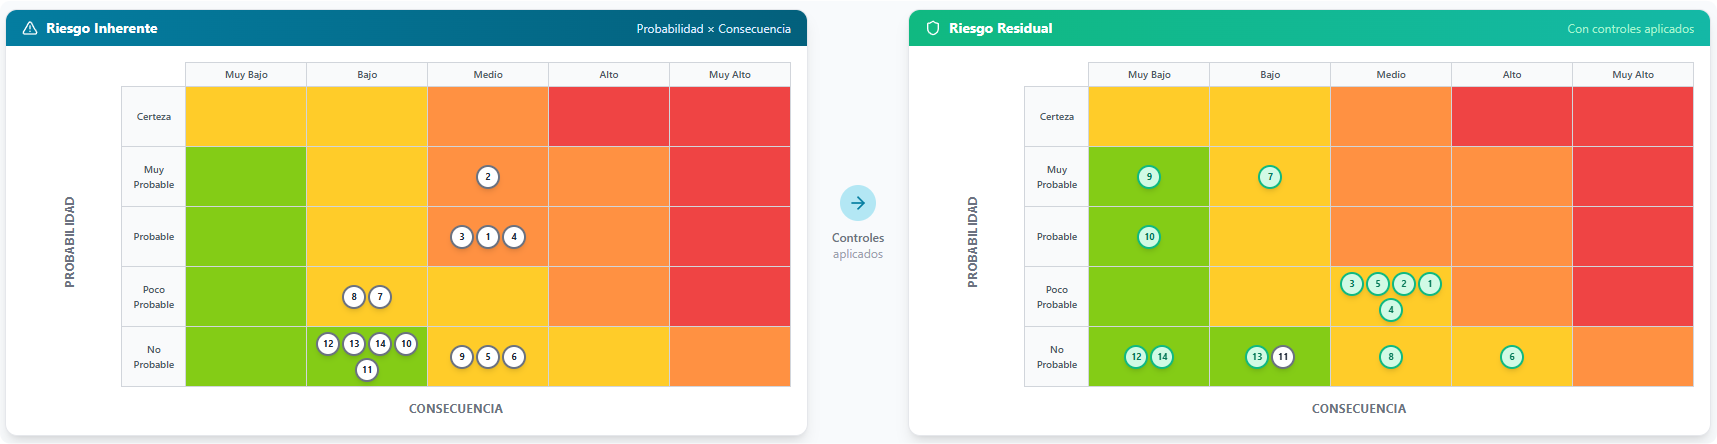
Comparison Matrices (Inherent vs. Residual) The visual core of the module consists of two heat matrices (Probability x Consequence) placed side by side, illustrating risk displacement:
- Inherent Risk (Left): Shows the original distribution of scenarios (represented by numbered circles) at their base risk levels, typically concentrated in higher criticality zones (orange/red).
- Residual Risk (Right): Projects the new location of those same scenarios once the system recalculates values considering applied controls. A visual shift toward lower criticality quadrants (yellow/green) is observed.
To facilitate analysis in executive presentations, the interface includes top buttons that allow toggling the view between a Dual matrix, only the Inherent, or only the Residual.
Performance Metrics At the bottom of the matrices, the screen provides additional details for decision-making:
- Acceptability Levels: A legend that tracks the migration of risk levels (for example, how many scenarios went from “Inadmissible” to “Acceptable”).
- Greatest Risk Reduction: A structured listing that highlights the specific assets or facilities that experienced the most significant percentage drop in their risk level thanks to registered controls, allowing validation of specific strategy effectiveness.
