The Risk panel acts as the platform’s analytical diagnostic center. Unlike the registration sections, this environment automatically consolidates data from all assessed scenarios to offer a quantitative and qualitative view of the organization’s protection status before applying mitigation measures.

The panel displays the site summary:
-
Global Level: The consolidated indicator that determines the overall vulnerability status of the organization (for example: Unacceptable).
-
Assessment Volume: The real-time counter of the number of scenarios that have been completed and validated within the current exercise.

Scenario Classification
Allows classifying scenarios by SDE (Scenario Distribution Index), and by CI (Criticality Index), enabling a global or specific result visualization.
The panel distributes information into four strategic quadrants to facilitate decision-making:
-
-
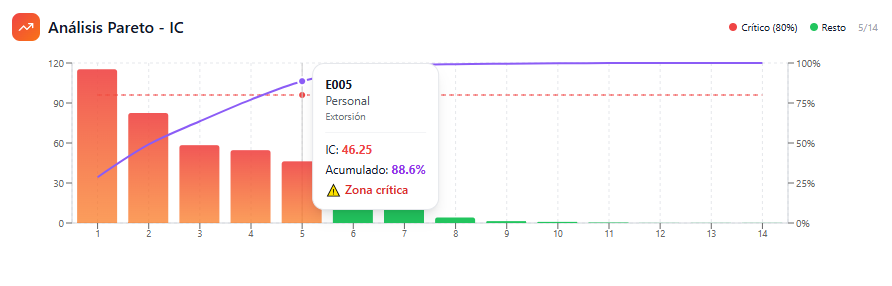
Pareto Analysis – CI (Criticality Index): This bar chart and distribution curve classifies scenarios by ordering them from highest to lowest impact. It enables applying the 80/20 rule to immediately identify the smaller percentage of threats that concentrate the greatest amount of critical risk (Red Zone), separating them from the rest of the operational scenarios.
-
-
-
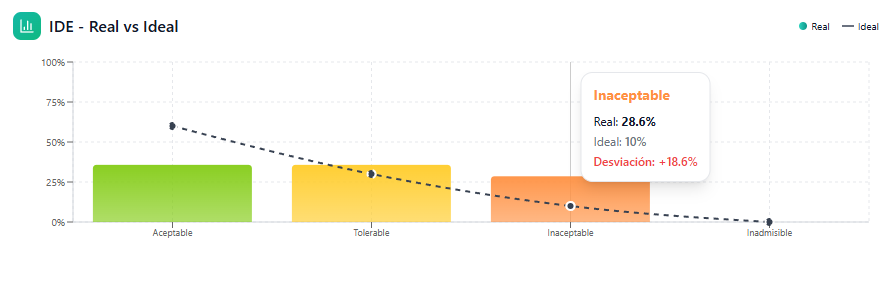
SDE – Real vs Ideal (Risk Index): A comparative chart that segments the distribution of assessed scenarios according to their normative acceptability levels. It contrasts the current Real situation against the expected Ideal line, dividing events into four strict categories: Acceptable, Tolerable, Unacceptable, and Inadmissible.
-
-
-
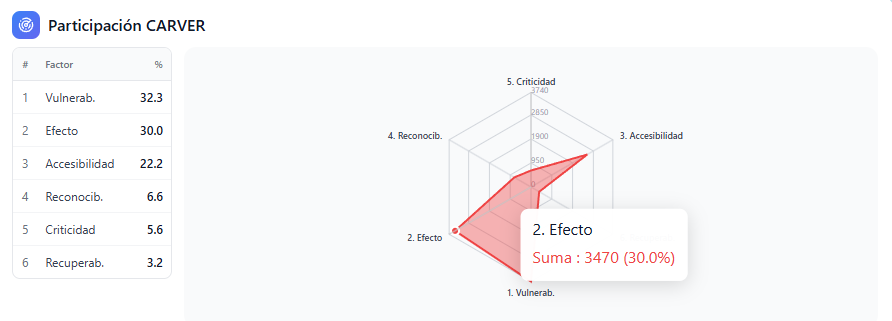
CARVER Participation: Through a percentage matrix and a radar (spider) chart, the system breaks down which specific methodology factors are weighing most heavily on global vulnerability. It shows the exact proportional distribution between critical components: Vulnerability, Effect, Accessibility, Recognition, Criticality, and Recoverability.
-
-
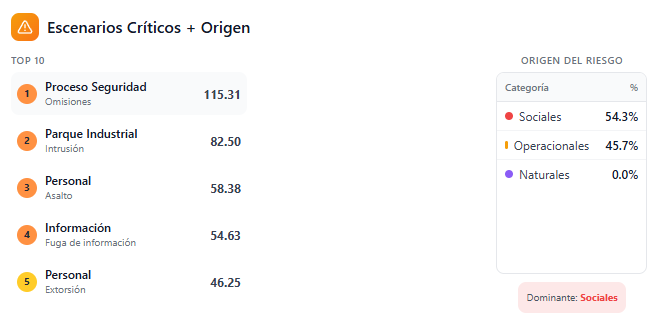
Critical Scenarios + Origin: An executive listing with the top specific threats that present the highest criticality indices, accompanied by a participation chart that categorizes whether the dominant risk origin is Social, Operational, or Natural.